


A double top means this

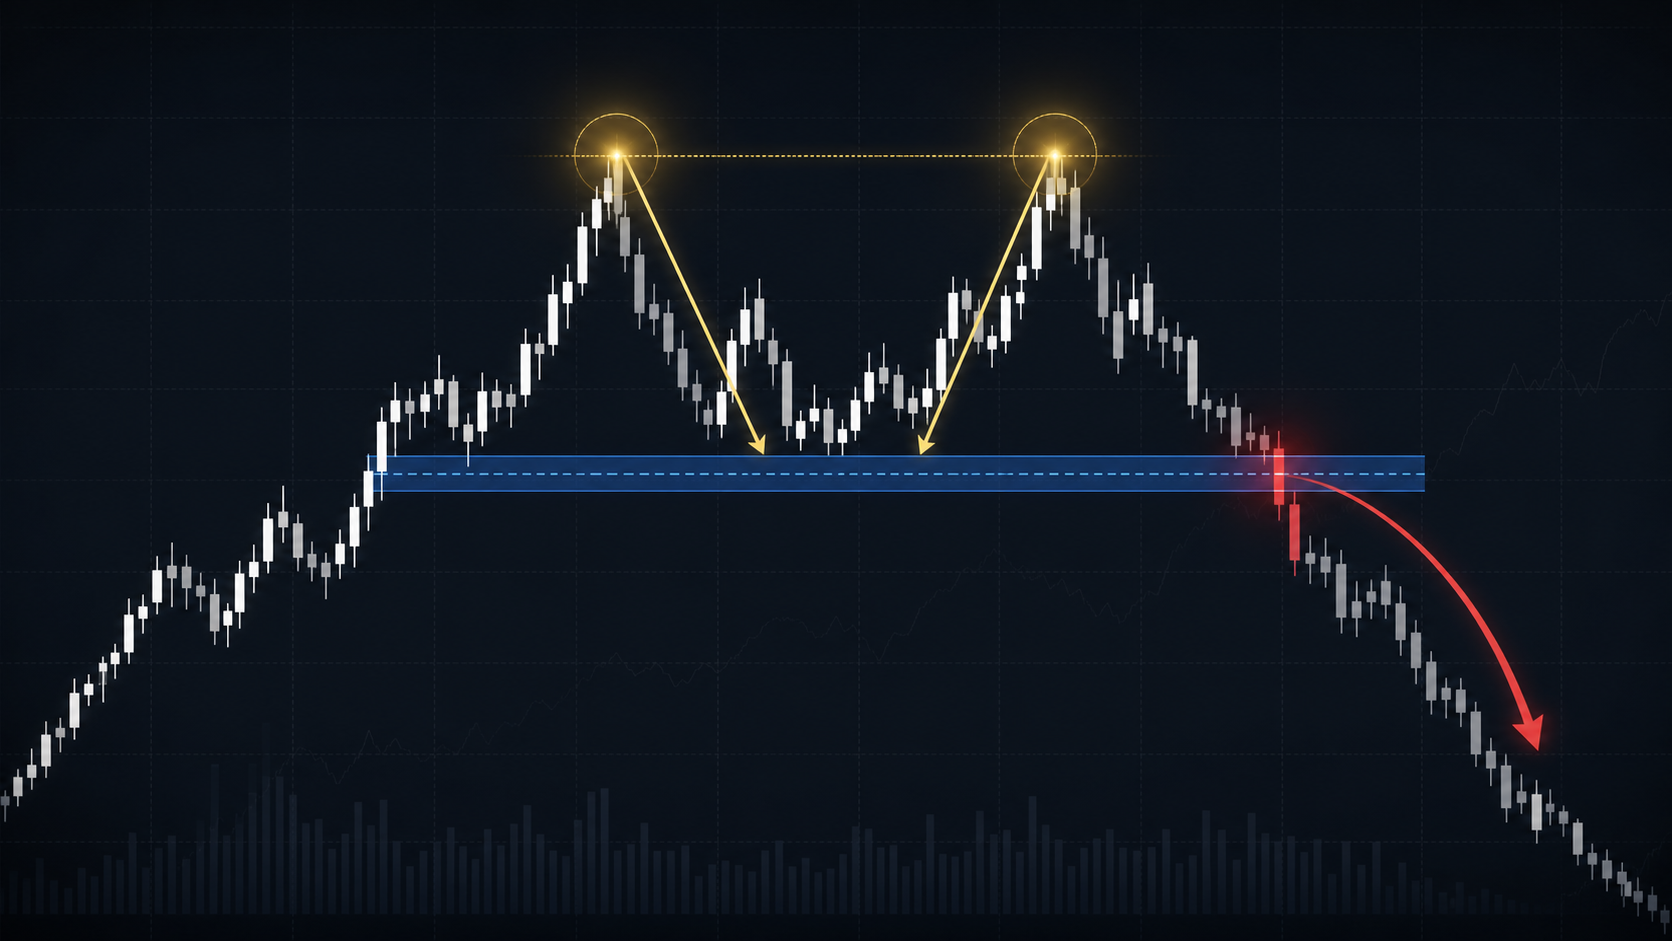
The double top is one of the most popular patterns in technical analysis. Almost every trader has seen it on a chart: price makes a high, pulls back, then tries to reach the same area again and fails to continue higher.
At first glance, it looks simple. Two highs near the same level, followed by a decline.
But a real double top is not just a shape. It is information about market behavior.
1. What Does a Double Top Actually Show?
A double top shows that buyers tried twice to break through a certain area, but failed to create continuation.
The first top shows where the market met resistance. Price then pulls back because some participants take profit or sellers become more active.
The second top is more important. It shows whether buyers still have strength. If price reaches the same area again and gets rejected, it is the first sign that bullish momentum is weakening.
2. Where Is the Confirmation?
Many traders make the mistake of selling immediately at the second top.
That is often too early.
The pattern is confirmed when price breaks the neckline area. This is the zone between the two tops where price previously found temporary support.
Until the neckline is broken, the market can still continue higher. A double top is not complete simply because two highs exist.
3. What Makes a High-Quality Double Top?
The signal becomes stronger when several conditions are present:
both tops form in a similar price zone;
the second top fails to create a convincing breakout;
there is visible rejection from the area;
the neckline is clearly defined;
the break below the neckline is impulsive;
after the break, price either retests the neckline or fails to recover above it.
The more of these conditions are present, the more meaningful the pattern becomes.
4. Why Does the Second Top Often Trap Traders?
The second top often looks like a new chance for trend continuation. This is where many traders buy because they expect a breakout.
But if the breakout fails, those buyers become trapped.
When price starts falling and the neckline breaks, some of them close their positions. This can accelerate the move lower because stop losses and new short positions are triggered around the same area.
5. How to Avoid Confusing Shape With Signal
Not every market structure with two highs is a double top.
Context matters:
was there a prior bullish move;
is the pattern forming around meaningful resistance;
is there weakness on the second attempt;
is there a real break of structure;
how does price react after the break.
Without context, the pattern may simply be sideways movement.
6. Practical Way to Read the Pattern
When you see a potential double top, do not think only about entry. First ask the right questions:
Where is the resistance zone?
How does price react on the second attempt?
Where is the neckline?
Is there an impulsive break?
Where does the idea become invalid?
This turns the pattern into a scenario instead of an emotional trade.
Conclusion
A double top does not automatically mean sell.
It means the market made two attempts to move higher, and the second attempt failed to show enough strength. The real meaning comes after the neckline break and the reaction that follows.
When you read it as participant behavior instead of just a visual shape, the pattern becomes much more useful.