


Liquidity Zones, Explained Like You’re Three Years Old

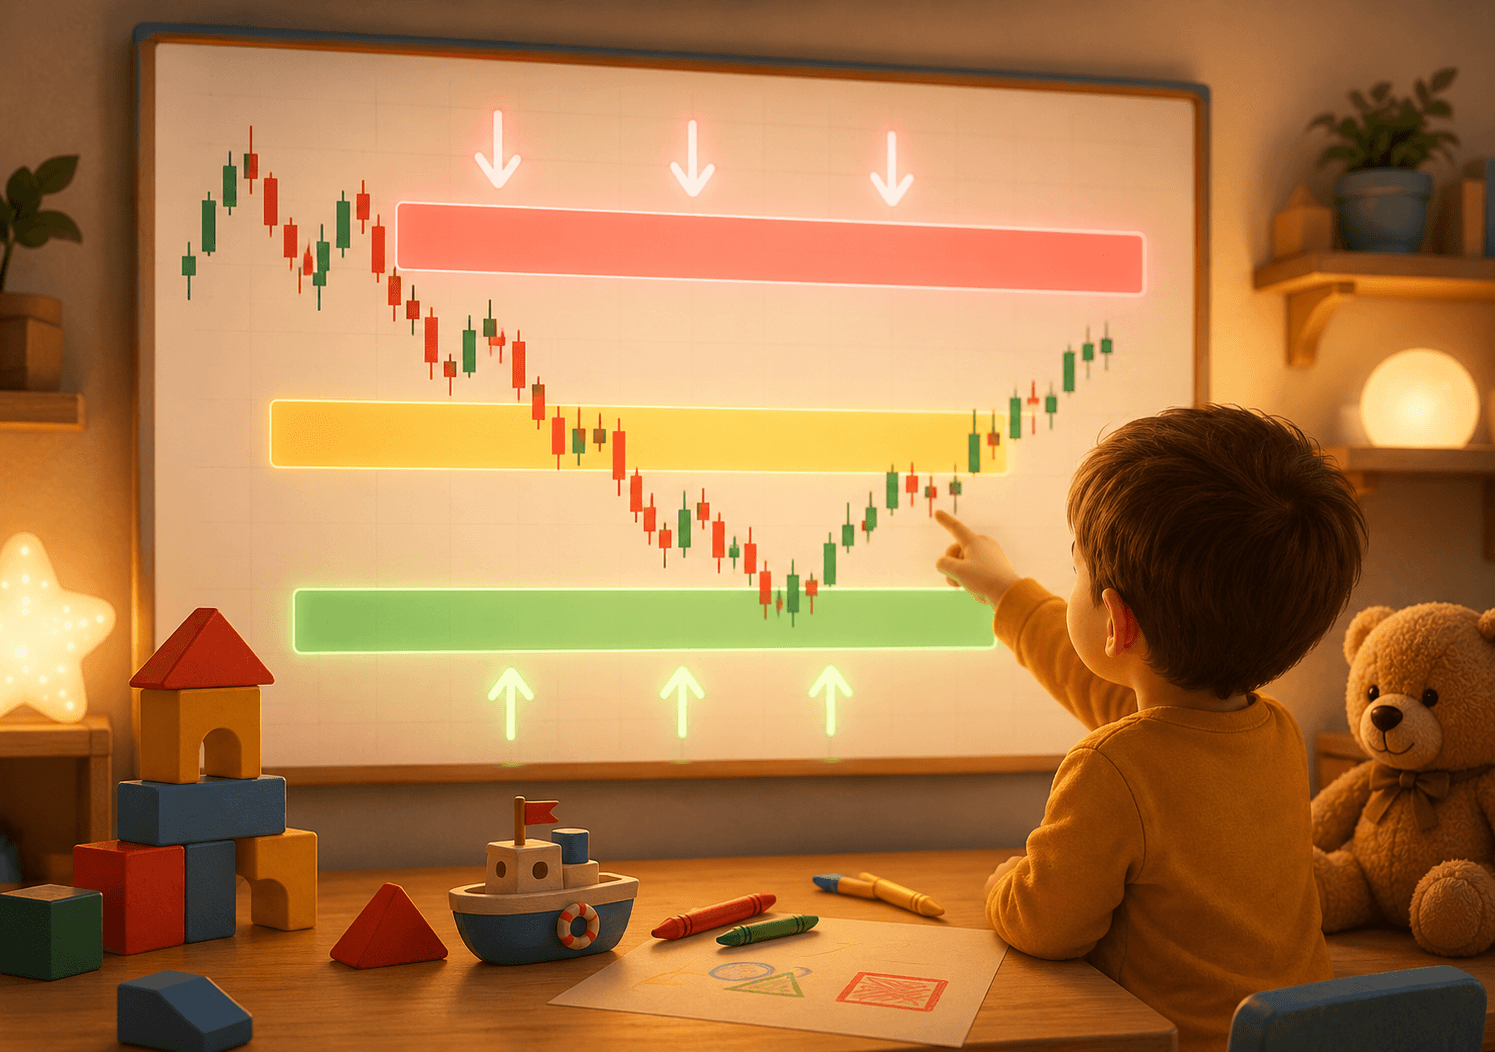
The first time I heard the phrase "liquidity zones," I assumed it was something horribly complicated. It turned out to be the opposite. It's simple enough to explain to a child — as long as we strip away the jargon traders like to hide behind.
Here's my attempt.
First: what is liquidity, actually
Picture yourself selling an old bicycle.
If you live in a big city and post the ad on a Sunday evening, you'll have five calls by morning. It sells within the hour, at a decent price. That's high liquidity — there are plenty of people ready to buy right now.
If you live in a village of twenty people, that bike might sit in the yard for months. Low liquidity. The only way to move it is to cut the price hard enough that somebody caves.
Markets work the same way. Liquidity means: how many willing counterparties exist at this moment.
And here's where it gets interesting. If you're the one trying to sell a thousand bicycles at once, you're not going looking for the village. You're going looking for the place with the biggest crowd of buyers.
Where the "crowd" sits on a chart
Large players have a problem retail traders don't: their size is so big that entering all at once ruins their own price.
So they need places with plenty of orders on the other side. And those places aren't random — they're predictable.
Think about where most people put their stops:
- Just below the last low, if they're long.
- Just above the last high, if they're short.
- Around round numbers — 1.1000, 50,000, 100.
- Under an obvious trendline that everyone draws the same way.
A stop is a market order sitting there, waiting to fire. If a hundred traders have stops below the same low, then below that low sits a pile of automatic sell orders. A pile of liquidity.
A liquidity zone is exactly that: a place on the chart where a large amount of pending orders has accumulated.
The version for a three-year-old
Picture a playground with a lake next to it.
All the children are standing at the water's edge, each holding an apple. The rule is: if the water touches their shoes, they drop the apple in.
Along comes a big person who really likes apples. He doesn't want to ask each child individually. So he does something simple — he wades into the lake and makes a wave.
The wave reaches the shore, touches everyone's shoes, and every child drops their apple at once. The big person collects the apples and leaves. The water settles back, as if nothing happened.
The children stare at the lake, puzzled: "Why did that wave come up for three seconds and then stop?"
The wave is the move that breaks the low or the high. The apples are the stops. The big person is the size that needed filling. And the water settling back is why that candle has a long wick and closes right back where it started.
What this looks like on a real chart
I'm not going to hand you a magic indicator, because there isn't one. But three things repeat often enough to be worth recognising:
Equal lows or equal highs. When price hits nearly the same level two or three times and reverses, that level starts to look like strong support. Which is precisely why stops pile up there. Equal levels are a glowing target.
A long wick that breaks through and comes straight back. Price dips below the low, sits there a few minutes, then closes back up. That's not a "failed breakout." That's collection.
Sharp moves right before news, or at the open of a session. Thin liquidity during quiet hours makes those moves cheaper to execute.
One thing I wish someone had told me sooner: not every break is a liquidity grab. Sometimes a low breaks because the market is simply falling. The difference is what price does afterwards. If it snaps back quickly and decisively, it was probably about the apples. If it keeps going and never looks back, it was real.
The most common mistake
People learn the concept and immediately start seeing liquidity everywhere. Every low becomes a "zone." Every wick becomes "manipulation." The chart gets buried under rectangles until nothing is readable.
The problem is that the concept explains why something happened — and that's far easier after the fact than before it.
A more useful way to apply it is as a filter, not a signal. Meaning: not "I see liquidity, so I'm entering," but "there are probably stops clustered under that level, so I won't put mine right there."
That single adjustment saves a surprising number of unnecessary losses.
What to do tomorrow
Open a chart you follow regularly. Daily timeframe, three months back.
Mark every spot where you have two or more lows at roughly the same level. Same for the highs. Draw nothing else.
Then look at what happened each time price reached those levels. How often did it break and return? How often did it break and keep going?
You won't get a strategy out of this exercise. You'll get something more useful — a feel for how the specific instrument you trade actually behaves. And feel is the one thing you can't download.
In short
Liquidity is the number of willing counterparties. Large orders go where the willing counterparties are. The biggest cluster of them sits wherever most people have placed their stops. And most people place their stops in obvious spots.
That's the whole concept. The rest is practice.
This material is for educational purposes and does not constitute investment advice. Trading financial instruments carries the risk of capital loss.